Age and sex composition may be described in terms of:
1. Median Age
The median age is the age at which exactly half the population is older and half is younger.
2. Sex Ratio
The sex ratio is the ratio of males to females in a given population, usually expressed as the number of males for every 100 females.
3. Age Dependency Ratio
The age-dependency ratio is the ratio of persons in the “dependent” ages (generally under age 15 and over age 64) to those in the “economically productive” ages (15-64 years) in a population.
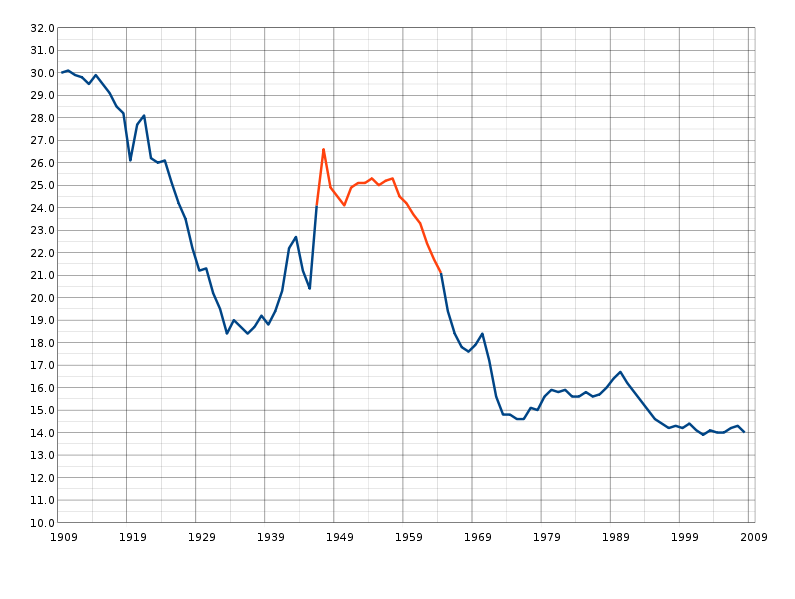
4. Life Expectancy
Life expectancy or expectation of life at a given age, is the number of years which a person of that age may expect to live according to the mortality pattern prevalent in the country. It is one of the best indicators of a country’s level of development and of the overall health status of the population.
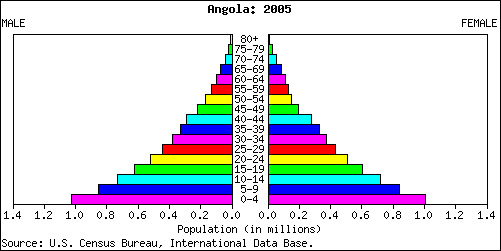
Population Pyramid
A population pyramid graphically displays a population’s age and sex composition. Horizontal bars present the numbers or proportions of males and females in each age group. The sum of all the age sex groups in the population pyramid equals 100% of the population. Pyramid may show single years of age or show data in age groups.
Each year a new cohort is born and appears at the bottom of the pyramid, while the cohorts above it move up. As the cohorts age, they inevitably lose members because of death and may gain or lose members because of migration. After age 45 the attrition process accelerates, causing the narrowing peak of all population pyramids. Such pyramids can tell a great deal about a population at a glance.
Profiles of Population Pyramid
Population of countries can differ markedly as a result of past and current patterns of fertility, mortality, and migration. However, they all tend to fall into three general profiles of age-sex composition:
1. Rapid growth is indicated by a pyramid with a large percentage of people in the younger ages.
2. Slow growth is reflected by a pyramid with a smaller proportion of the population in the younger ages.
3. Zero growth or decreasing populations are shown by roughly equal numbers of people in all age ranges, tapering off gradually at the older ages.