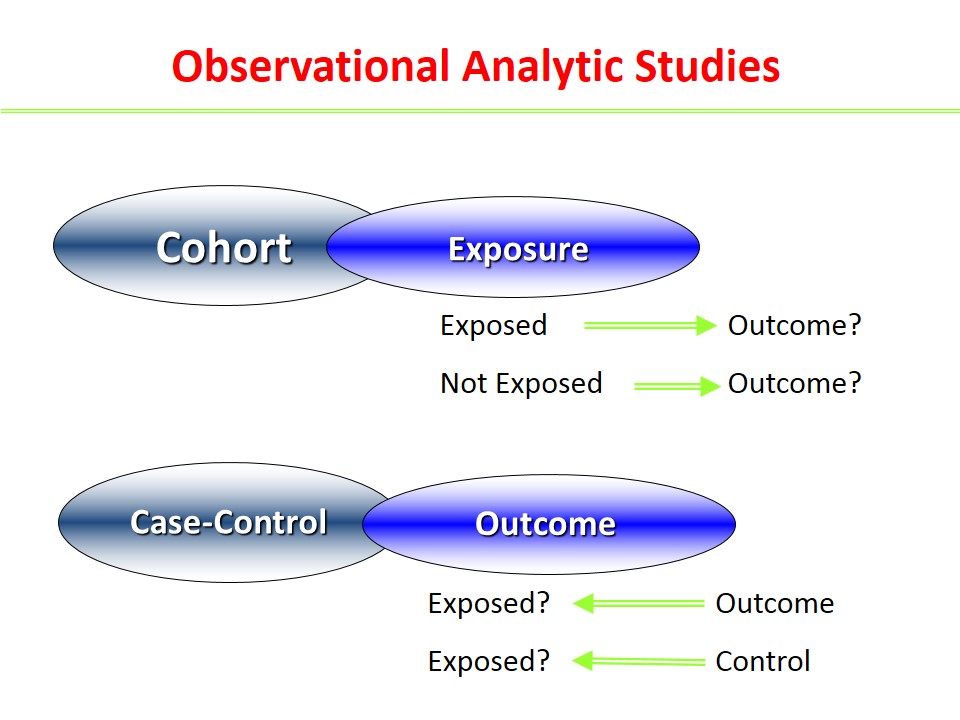
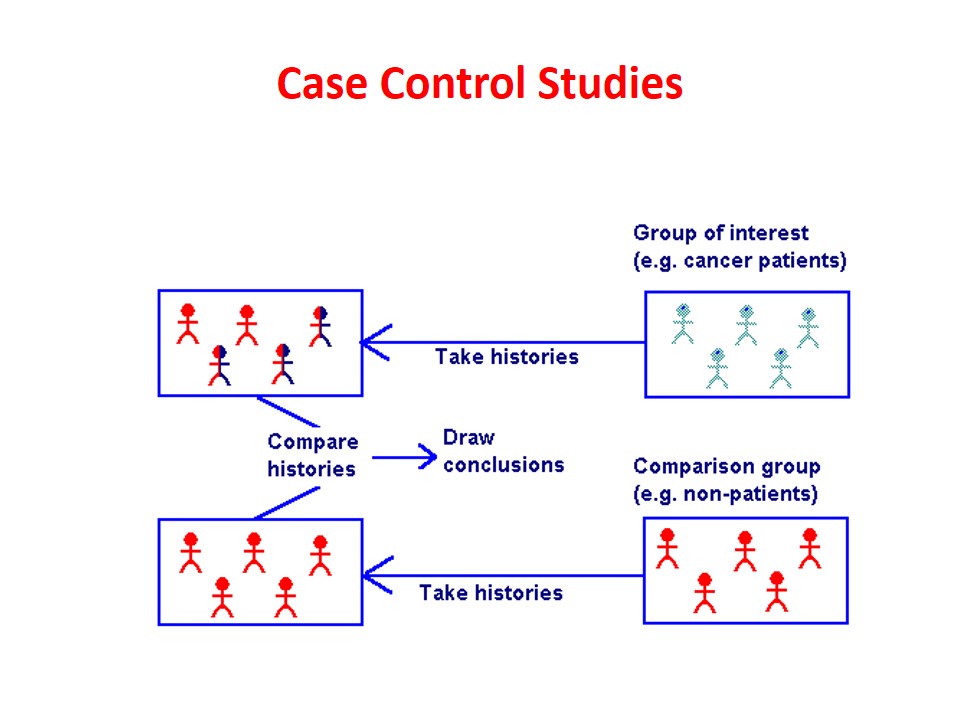
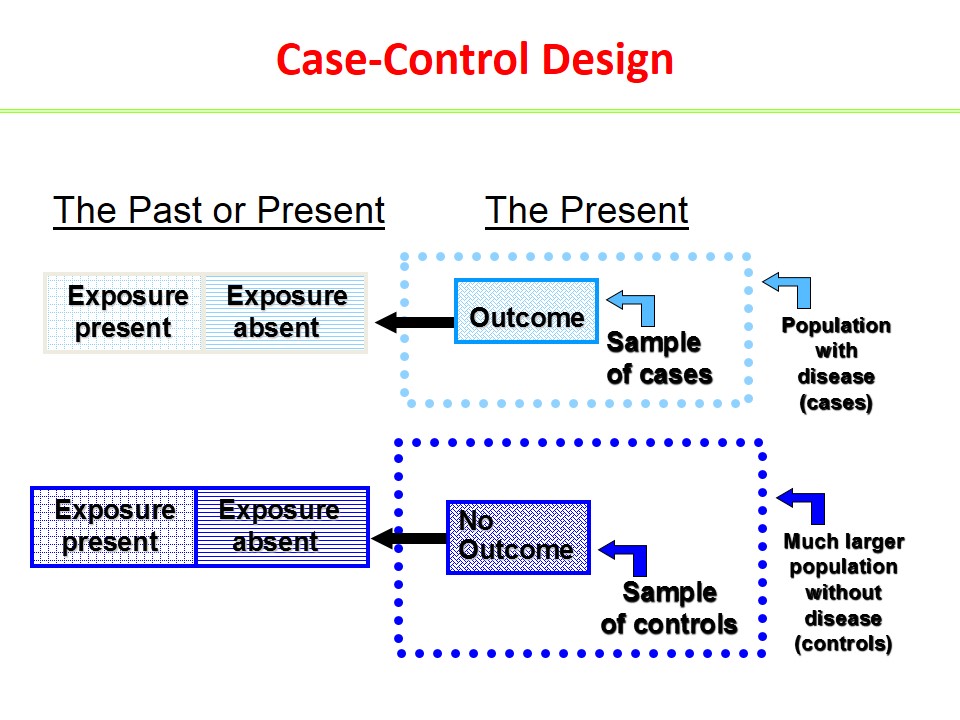
In case control study, we start with diseased group (“cases”); which we compare with non-diseased group (“controls”). We look back in time for possible differences in exposure factors. Thus it is also known as a “retrospective” study.
In its simplest form, we can say that case control study is comparing a case series to a matched control series.
History
Possibly the first case control study was by Whitehead in Broad Street pump episode, 1854 (Snow did not do a c-c study). First modern case control study was Janet Lane-Claypon’s study of breast cancer and reproductive history in 1926. Four case control studies implicating smoking and lung cancer appeared in 1950, establishing the method in epidemiology.
Steps in a Case-control Study
1. Define the study’s objectives
2. Identify and select “cases”: optimally, persons with new onset of disease
3. Select “controls”
4. Collect data: measure level of “exposure” in cases and controls
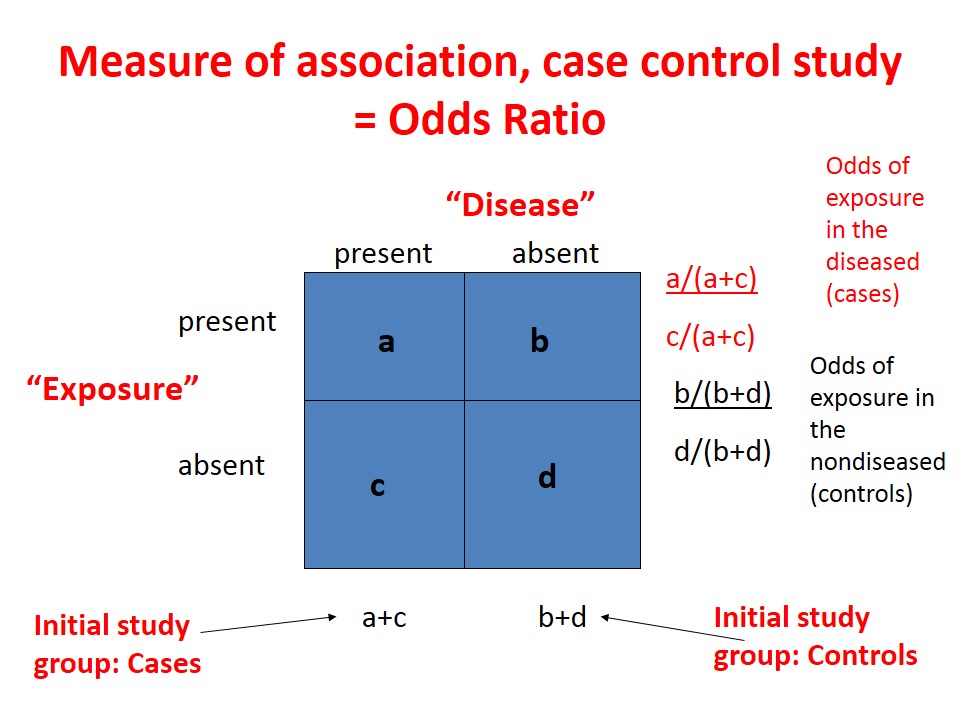
5. Analyze data: compare the exposure frequencies in those with and without disease. Measure of association = Odds ratio (exposure odds ratio)
6. Interpret data
Data Analysis
• Exposure odds calculation for both case and control groups:
– exposure odds for cases = a/c
– exposure odds for control group = b/d
• ODDS RATIO (OR) = a.d/b.c
Case-control study: risk factors for AIDS
Initial etiologic investigation for possible AIDS risk factors was carried out. The cases were gay men with AIDS (n = 50) from New York, San Francisco, Los Angeles, and Atlanta. The controls were gay men without AIDS from same cities, matched by age, recruited from outpatient clinics (n = 120)
Ann Intern Med 1983;99:145-151.
Strengths
• Quick
• Relatively inexpensive (no follow-up)
• Excellent for studying rare diseases
• Useful in etiologic exploration studies (“fishing expeditions”)
• No loss to follow-up
Weaknesses
• Cannot directly measure incidence rates (risk) or relative risk (In certain circumstances, can use the odds ratio to estimate the relative risk)
• Greater potential for bias compared with cohort studies
Examples
• Study to determine an association between autism and vaccination
• Study to determine an association between lung cancer and radon exposure
• Study to determine an association between salmonella infection and eating at a fast food restaurant
Odds Ratio
In a case-control study, the risk of disease cannot be directly calculated because the population at risk is not known. Odds ratio is the measure used with case-control studies.
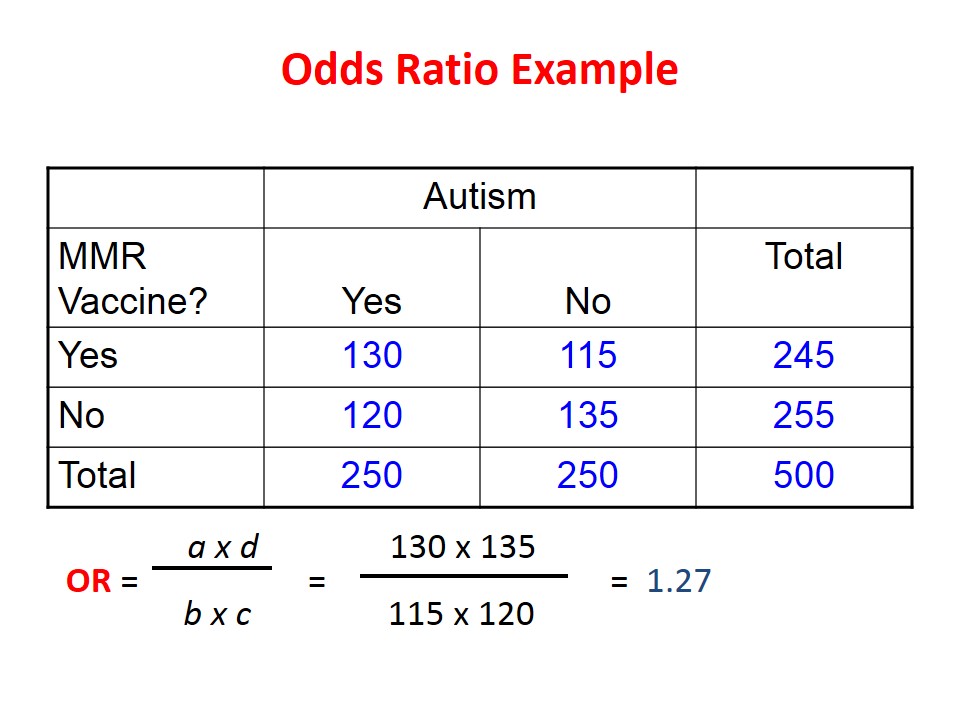
To calculate the measure of an association between the outcome of autism and the exposure of the Measles-mumps-rubella vaccine, a case-control study was conducted, with the results shown in the table. To calculate the OR, we multiply cell A, which is 130, times cell D, which is 135. We divide this by the quantity of Cell B, which 120, times cell C, which is 115. The OR comes out to be 1.27.
From this, we can say that the odds of being exposed to the MMR vaccine were 1.27 times higher in those who had autism than in those who did not have autism.
Interpretation
Both the relative risk and odds ratio are interpreted as follows:
= 1 – indicates no association
> 1 – indicates a positive association
< 1 – indicates a negative association
Here are a few example interpretations:
If the RR = 5
– People who were exposed are 5 times more likely to have the outcome when compared with persons who were not exposed
If the RR = 0.5
– People who were exposed are half as likely to have the outcome when compared with persons who were not exposed
If the RR = 1
– People who were exposed are no more or less likely to have the outcome when compared to persons who were not exposed
Types of Cohort Studies
You may also NEST a case-control study within a cohort study
Example:
– Begin with a cohort of 10,000 individuals without rheumatoid arthritis
– Test for the presence of RA antigen
– Assume those with RA antigen are the exposed and those without the controls
– Follow for 10 years and determine the incidence of disease among both cohorts
– This reduces the cost of testing
Case control studies aim to identify if there is an association between a potential risk factor and a particular disease or outcome. These studies are used frequently to identify the:-
– Source of infection during epidemics
– Evaluation of vaccine efficacy
– Identification of factors which predispose to severe disease or death.
Three distinct features
1. Both exposure and outcome (Disease) have occurred before the start of the study.
2. The study proceeds backward from effect to cause
3. It uses a control or comparison group to support or refute an inference.
 howMed Know Yourself
