In inferential statistics, we use patterns in the sample data to draw inferences about the population represented, accounting for randomness. There are two basic approaches are:
- Hypothesis testing
- Estimation
Common goal is to conclude on the effect of an independent variable (exposure) on a dependent variable (outcome).
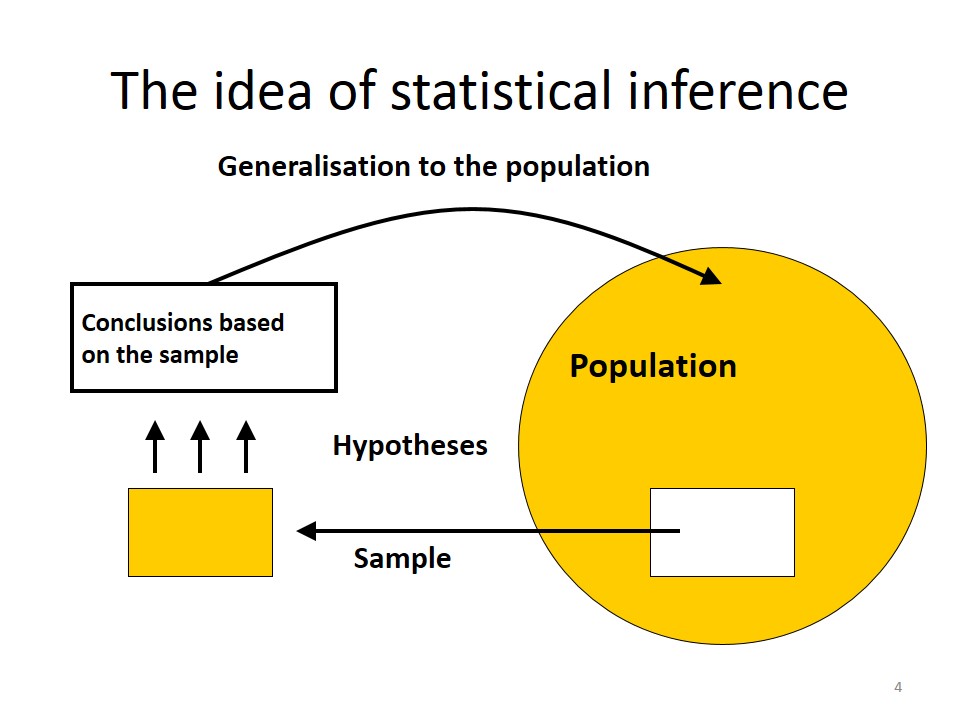
The aim of a statistical test
To reach a scientific decision (“yes” or “no”) on a difference (or effect), on a probabilistic basis, on observed data.
Why significance testing?
Consider an example of gastroenteritis outbreak in Karachi:
“The risk of illness was higher among diners who ate home preserved pickles (RR=3.6).”
Is the association due to chance?
The two hypothesis!
| There is NO difference between the two groups(=no effect) | Null Hypothesis (H0)(e.g.: RR=1) |
| There is a difference between the two groups(=there is an effect) | Alternative Hypothesis (H1)(e.g.: RR=3.6) |
When you perform a test of statistical significance you usually reject or do not reject the Null Hypothesis (H0).
Gastroenteritis outbreak in Karachi
- Null hypothesis (H0): “There is no association between consumption of green pickles and gastroenteritis.”
- Alternative hypothesis (H1): “There is an association between consumption of green pickles and gastroenteritis.”
Hypothesis testing and null hypothesis
Tests of statistical significance are applied. If:
Data not consistent with H0:
– H0 can be rejected in favour of some alternative hypothesis H1 (the objective of our study).
Data are consistent with the H0:
– H0 cannot be rejected
You cannot say that the H0 is true. You can only decide to reject it or not reject it.
How to decide when to reject the null hypothesis?
H0 is rejected using reported p value.
p-value is the probability that our result (e.g. a difference between proportions or a RR) or more extreme values could be observed under the null hypothesis.
p values – practicalities
If p value is small, it indicates low degree of compatibility between H0 and the observed data, you reject H0, the test is significant.
If p value is large, there is high degree of compatibility between H0 and the observed data, you don’t reject H0, the test is not significant.
We can never reduce to zero the probability that our result was not observed by chance alone.
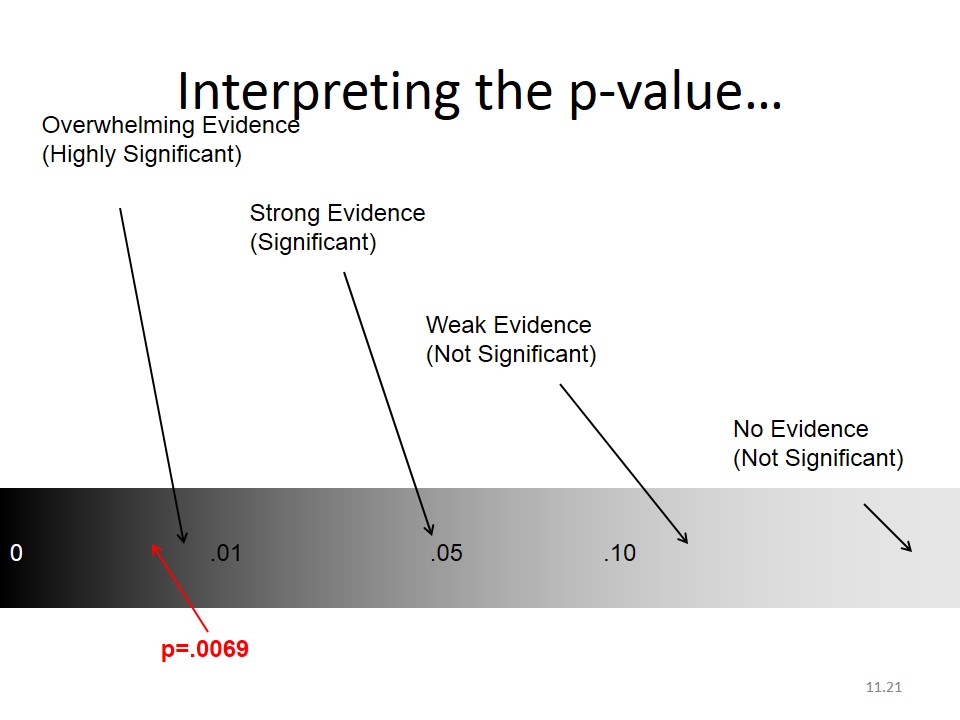
Levels of significance – practicalities
p value > 0.05 = H0 non rejected (non significant)
p value ≤ 0.05 = H0 rejected (significant)
BUT:
Give always the exact p-value rather than significant vs non-significant.
Examples from the literature
- ”The limit for statistical significance was set at p=0.05.”
- ”There was a strong relationship (p<0.001).”
- ”…, but it did not reach statistical significance (ns).’
- ’The relationship was statistically significant (p=0.0361)’
P value cut off of 0.05 is an agreed convention, not an absolute truth.
”Surely, God loves the 0.06 nearly as much as the 0.05” (Rosnow and Rosenthal, 1991)
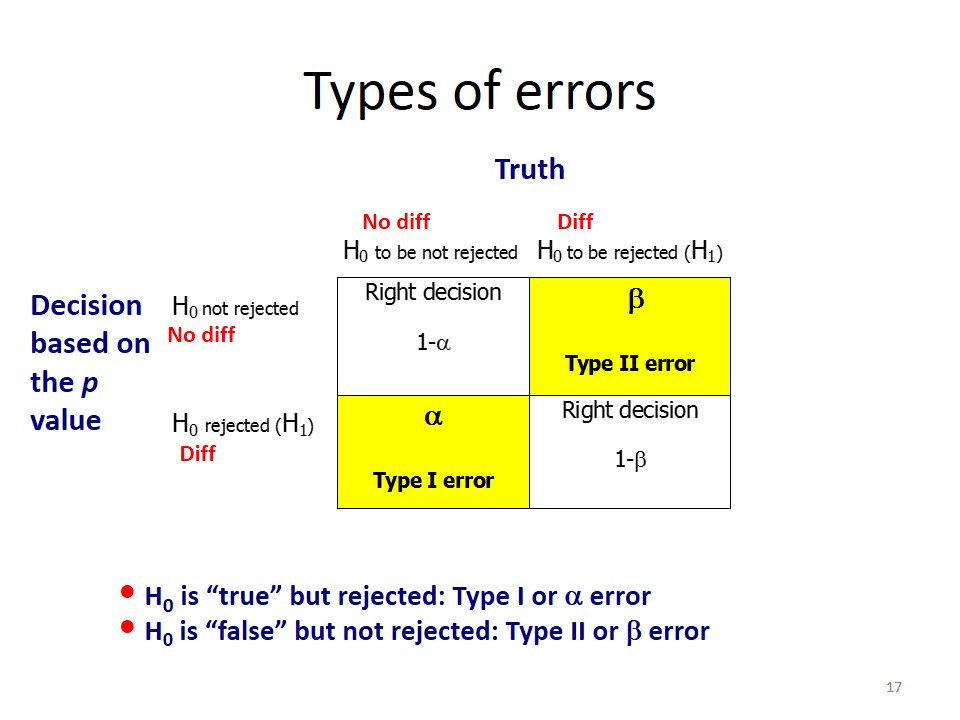
p = 0.05 and its errors
p value is used for decision making but still there are 2 possible errors:
Type I or alpha error
H0 should not be rejected, but it was rejected :
Type II or beta error
H0 should be rejected, but it was not rejected :
Keep in mind that committing a Type I error OR a Type II error can be VERY bad depending on the problem.
Probability of Type I error:
– Value of α is determined in advance of the test
– The significance level is the level of α error that we would accept (usually 0.05)
Probability of Type II error:
– Value of β depends on the size of effect (e.g. RR, OR) and sample size
– 1-β: Statistical power of a study to detect an effect on a specified size (e.g. 0.80)
– Fix β in advance: choose an appropriate sample size
Principles of significance testing
1. Formulate the H0
2. Test your sample data against H0
3. The p value tells you whether your data are consistent with H0 i.e, whether your sample data are consistent with a chance finding (large p value), or whether there is reason to believe that there is a true difference (association) between the groups you tested
4. You can only reject H0, or fail to reject it!
Conclusions of a Test of Hypothesis…
- If we reject the null hypothesis, we conclude that there is enough evidence to infer that the alternative hypothesis is true.
- If we fail to reject the null hypothesis, we conclude that there is not enough statistical evidence to infer that the alternative hypothesis is true. This does not mean that we have proven that the null hypothesis is true!
Concepts of Hypothesis Testing
The two hypotheses are called the null hypothesis and the other the alternative or research hypothesis. The usual notation is:
H0: — the ‘null’ hypothesis
H1: — the ‘alternative’ or ‘research’ hypothesis
The two possible decisions that can be made:
- Conclude that there is enough evidence to support the alternative hypothesis (also stated as: reject the null hypothesis in favor of the alternative)
- Conclude that there is not enough evidence to support the alternative hypothesis (also stated as: failing to reject the null hypothesis in favor of the alternative)
NOTE: we do not say that we accept the null hypothesis if a statistician is around.
The testing procedure begins with the assumption that the null hypothesis is true. We find whether the sample mean is in the guts of the sampling distribution??
There are three ways to determine this:
1. Unstandardized test statistic
2. Standardized test statistic
3. The p-value approach
Criticism on significance testing
“Epidemiological application need more than a decision as to whether chance alone could have produced association.” (Rothman et al. 2008).
Estimation of an effect measure (e.g. RR, OR) rather than significance testing. The epidemiologist needs measurements rather than probabilities, c2 is a test of association. OR, RR are measures of association on a continuous scale when there are infinite number of possible values.
The best estimate is the point estimate.
Confidence interval (CI)
Confidence interval is the range of values, on the basis of the sample data, in which the population value (or true value) may lie.
Frequently used formulation:
„If the data collection and analysis could be replicated many times, the CI should include the true value of the measure 95% of the time .”
Confidence interval indicates the amount of random error in the estimate. It can be calculated for any „test statistic“, e.g.: means, proportions, ORs, RRs
Width of confidence interval depends on:
- The amount of variability in the data
- The size of the sample
- The arbitrary level of confidence you desire for your study (usually 90%, 95%, 99%)
A common way to use confidence interval regarding OR/RR is :
- If 1.0 is included in CI à non significant
- If 1.0 is not included in CI à significant
Significance testing evaluates only the role of chance as alternative explanation of observed difference or effect. Confidence intervals are more informative than p values.
What we have to evaluate the study
c2 A test of association. It depends on sample size.
p value Probability that equal (or more extreme) results can be observed by chance alone
OR, RR Direction & strength of association,
if > 1 risk factor,
if < 1 protective factor
(independently from sample size)
CI Magnitude and precision of effect
Comments on p-values and Confidence Intervals
Presence of significance does not prove clinical or biological relevance of an effect. A lack of significance is not necessarily a lack of an effect: “Absence of evidence is not evidence of absence”.
A huge effect in a small sample or a small effect in a large sample can result in identical p values. A statistical test will always give a significant result if the sample is big enough. p values and confidence intervals do not provide any information on the possibility that the observed association is due to bias or confounding.