Central Tendency doesn’t tell us everything. Dispersion/Deviation/Spread tells us a lot about how a variable is distributed. We are most interested in Standard Deviations (σ) and Variance (σ2)
Dispersion
Once you determine that the variable of interest is normally distributed, ideally by producing a histogram of the scores, the next question to be asked about the normal distribution curve is its dispersion: how spread out are the scores around the mean. Dispersion is a key concept in statistical thinking.
The basic question being asked is how much do the scores deviate around the mean? The more “bunched up” around the mean the better your ability to make accurate predictions.
Mean Deviation
The key concept for describing normal distributions and making predictions from them is called deviation from the mean. We could just calculate the average distance between each observation and the mean. We must take the absolute value of the distance, otherwise they would just cancel out to zero!
Is it Really that Easy?
- No!
- Absolute values are difficult to manipulate algebraically
- Absolute values cause enormous problems for calculus (Discontinuity)
- We need something else…
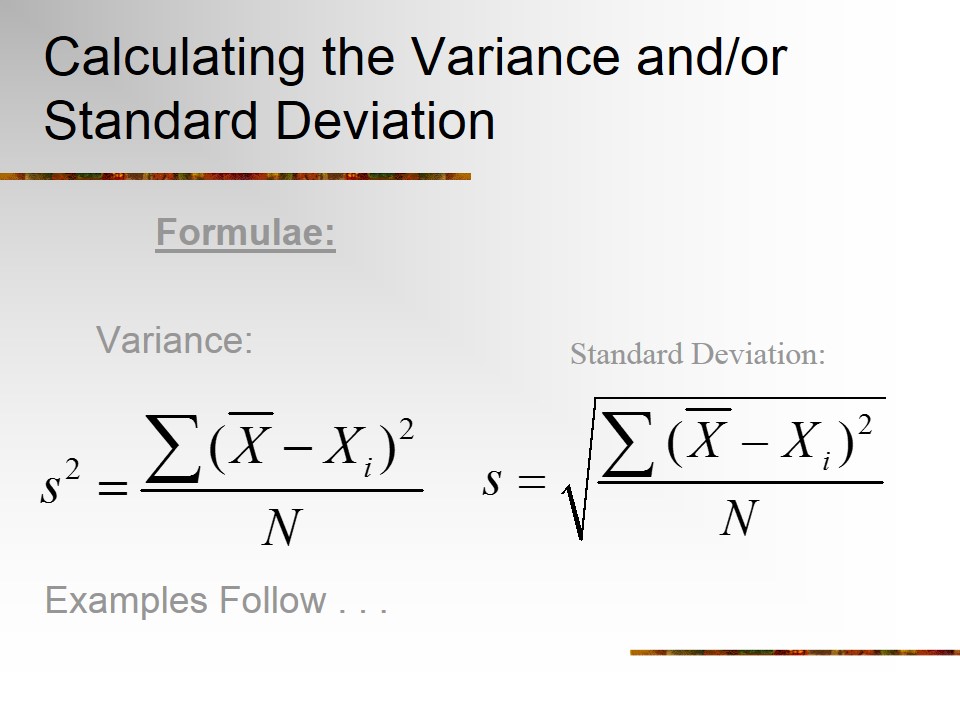
Variance and Standard Deviation
Instead of taking the absolute value, we square the deviations from the mean. This yields a positive value. This will result in measures we call the Variance and the Standard Deviation
For Sample-
s: Standard Deviation
s2: Variance
For Population
σ: Standard Deviation
σ2: Variance
In a normal curve, area corresponding to
o 1 SD will comprise 68% of total area
o 2 SD will comprise 95% of total area
o 3 SD will comprise 99.7% of total area
( The 68- 95-99.7 rule)
Coefficient of Variance
Coefficient of variance measures the spread the spread of data set as a proportion of its mean. It is expressed as percentage. It is ratio of sample standard deviation to sample mean. CV of population is based on expected value and SD of a random variable
CV = standard deviation/mean x 100
Percentiles
Percentiles give variability of the distribution. The p’th percentile of distribution is the value such that p% of observations fall at or below it. Median is the 50th percentile. They are used in calculation of growth charts for nutritional surveillance and monitoring
Quartiles
Quartiles are the values that divide the data into four groups containing equal numbers of observations. They are the 25th and 75th percentiles.
First quartile is the median of observations below the median of the complete data set, third quartile is the median of observations above the median of the complete data set.
Range
The range of a sample /data set is the difference between the largest and smallest observed value of some quantifiable characteristic. It is a simple summary measure, but crude. Like mean it is affected by extreme values
Data: 2,3,4,5,6,6,6,7,7,8,9
RANGE 2- 9= 7
Interquartile Range (IQR)
It is calculated by taking difference between upper and lower quartiles. IQR is the width of an interval which contains middle 50% of sample. It is smaller than range and less affected by outliers.
Data: 2,3,4,56,6,6,7,7,8,9
Upper quartile=7, lower quartile=4, IQR=3