Graphic record of summated electrical activity of heart obtained by electrodes placed on body surface.
Electrocardiograph is the instrument to record ECG
Willem Einthoven (1860 -1927) was the first to develop ECG Machine in 1903. He, for the first time, recorded electrical activity of heart from body surface. He named it ‘Elektrokardiogramme’ (EKG) which later on anglicized to ‘Electrocardiogram’ (ECG). He won Noble Prize in 1924
- Cells at rest are polarized –negative from interior & positive from exterior
- Action Potential records voltage inside the cell
- ECG records voltage out side the cells
Cardiac Impulse
Cardiac impulse arises in SA node
Spreads to both atria and AV node
Delay of 0.13 sec in AV node
Goes to right and left bundle branches
Through purkinje fibersdistributed to the whole cardiac muscle
Principles of ECG
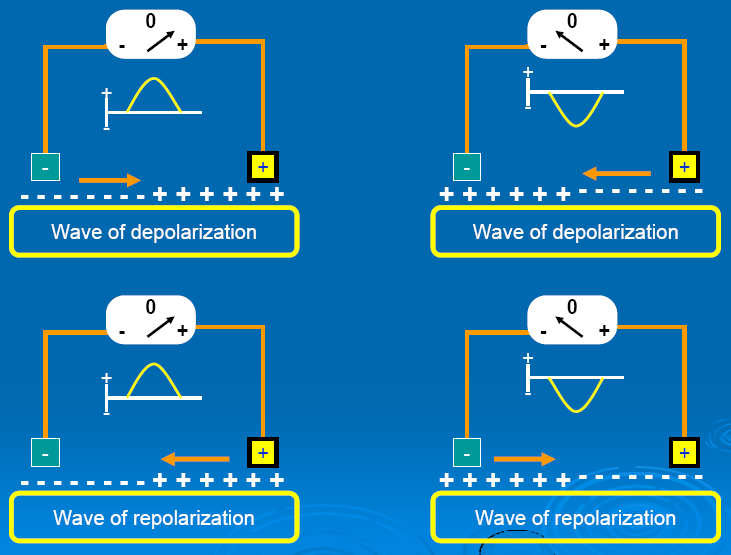
Electrical activity is recorded when part of muscle fiber is depolarized/repolarized
No electrical activity is recorded when muscle fiber is fully depolarized/repolarized
Positive electrode
- present in area of positivity
- upward deflection will be recorded
Negative electrode
- present in area of negativity
- downward deflection will be recorded
Electrocardiograph –ECG Machine
A Galvanometer having an electromagnet and amplifier detects voltage difference.
Amplifier enhances the signal
Electromagnet has two poles positive & Negative
Leads connect the poles of ECG machine with electrodes
Electrodes are placed on body surface
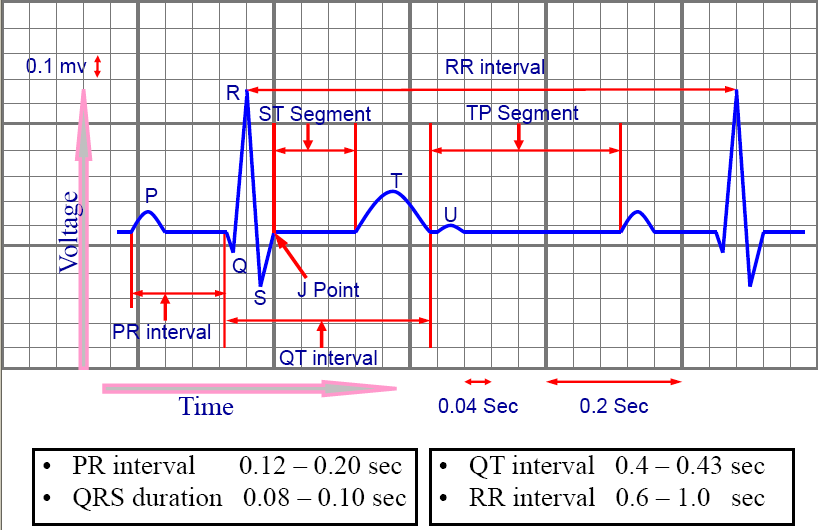
Electrocardiogram
Isoelectric line or segment
A flat line on ECG tracing with out any wave
Interval
A flat line on ECG tracing having at least one ECG wave
Calculation of heart rate
60/time in sec between 2 consecutive R waves
300/no of large squares between 2 consecutive R waves
1500/no of small squares between 2 consecutive R waves
6 second strip
ECG Lead
Pair of two electrodes connected to electrocardiograph with wires constitute a LEAD
A lead measures voltage difference between two electrodes
Stylus (needle) of ECG machine moves up and down with changing voltage
Waves are recorded on ECG paper which moves beneath the stylus –ECG recording
Types of Leads:
Limb leads
I, II, III -Bipolar leads
aVR, aVL, aVF –Unipolarleads
Chest leads
V1, V2, V3, V4, V5, V6 –Unipolarleads
Lead Axis is the imaginary straight line connecting the two electrodes is called AXIS of the lead
By convention axis of a lead directs toward +ve electrode
A lead records potential difference along its axis (between two electrodes)
Bipolar limb leads
+ve electrode is placed on one limb and –ve on the other
Measure electrical potential difference between +ve and –ve electrodes
Bipolar limb leads
Lead I
+ve electrode on left arm
-ve on right arm
Lead II
+ve electrode on left foot
-ve on right arm
Lead III
+ve electrode on left foot
-ve on left arm
Einthoven’s Triangle
An equilateral Triangle formed by the Axes of three Bipolar limb leads with heart in its centre
Einthoven’s law
Electrical potentials of Bipolar limb leadsI and III equal that of lead II
I + III = II
Unipolarlimb leads
Also called Augmented limb leads
+ve electrode is placed on one limb and the other two limbs jointly act as negative electrode
+ve electrode is called ‘exploring electrode’
-ve electrode is called ‘indifferent electrode’
Voltage of indifferent electrode is kept at almost zero
Actual voltage in the area of +ve electrode is measured
Augmentation enhances the voltage by about 50%
Lead aVF
+ve electrode on left foot
Both upper arms act as indifferent electrode
Lead aVL
+ve electrode on lest arm
Right arm and left foot act as indifferent electrode
Lead aVR
+ve electrode on right arm
Left arm and left foot act as indifferent electrode
Chest (Precardial) leads
Unipolarleads
+ve electrode is placed on chest
All the three limbs jointly act as negative (indifferent) electrode
V1 to V6
Frontal plane leads
Limb leads: Record electrical activity in frontal plane (superior/inferior & right/left)
Horizontal plane leads
Precardial leads: Record electrical activity in horizontal plane (anterior/posterior & right/left)
Cardiac Vector
Any entity having direction and magnitude can be represented by a Vector
Electrical currents generated in the heart have both direction and magnitude –so can be represented by vector
Moving wave of depolarization or repolarization can be represented by a VECTOR
Vector is represented by an arrow
By convention arrow head points towards +ve area
Length of the arrow represents voltage
Instantaneous Mean Vector
Many vectors summate/cancel each other and the net resultant vector is called InstantaneousMean Vector
Instantaneous Mean Vector is recorded on ECG according to its relation with a particular lead axis
Septal vector
Left to right & generally downwards
Base to apex vector
Right to left and downwards
Apex to base vector
Left to right and upwards
Mean QRS Vector
Represents mean electrical axis of ventricles
Normal direction is +59°
Parallel with lead II axis
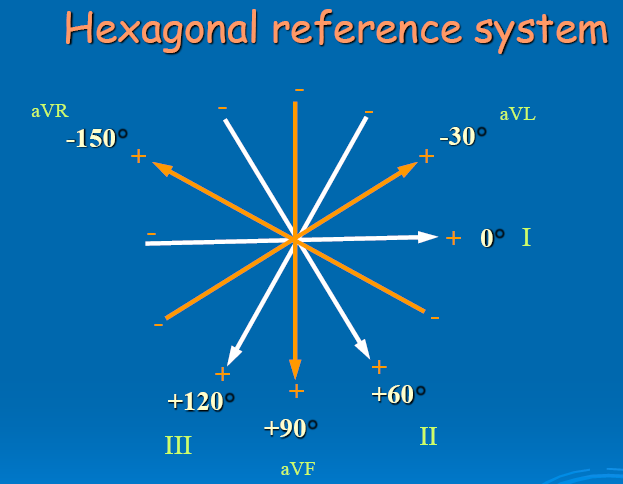
Direction is determined by Hexagonal reference system
Determining limb lead potentials from mean QRS vector
Drawing limb lead axes
Drawing of mean QRS vector
Drawing perpendiculars on lead axes
Drawing projected vectors
Bipolar limb leads
Can be determined by knowing net Potential & Polarity in any two bipolar limb leads
Lead I and III are used preferably
Subtraction of smaller deflection from the larger one to get net potential
Net potential is plotted along axes of lead I and III
Hemifield
A perpendicular to any lead axis that passes through centre of the heart divides the lead into two hemifields
One hemifieldis +ve (towards +ve electrode) and the other is -ve (towards –ve electrode)
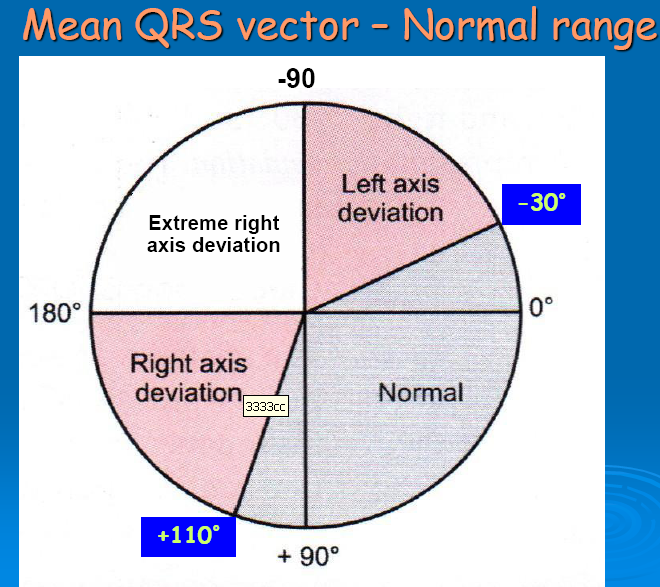
Deviation of Mean QRS Vector
Left axis deviation
From -30o to -90o
Right axis deviation
From +110oto +180o
Extreme right axis deviation
Between 180oand -90o
Conditions affecting Mean QRS Vector
1. Ventricular hypertrophy
Deviates towards hypertrophied ventricle
2. Bundle branch block
Deviates towards the block
3. Myocardial infarction
Deviates away from infarction
4. Ventricular ectopic pace maker
Depends upon locationof the pace maker
T Wave
At start of repolarization myocardium is fully contracted
High intraventricular pressure reduces blood to endocardium, so it repolarizes low (last)
Epicardium near Apex of the heart repolarizes first
T wave vector remains base to apex
T wave polarity is similar to QRS complex
 howMed Know Yourself


