Statistics is the art and science of making decisions in the face of uncertainty. Bio statistics is statistics as applied to the life and health sciences.
The press frequently quotes scientific articles about:
• Diet
• The Environment
• Medical care, etc.
Effects are often small and vary greatly from person to person. We need to be familiar with statistics to understand and evaluate conflicting claims.
Vital statistics
A branch of statistics that deals with the changes and most basic events of human populations: e.g., natality (birth); mortality (death); morbidity (illness and disease); injuries; marriage, etc.
Vital statistics are indispensable in studying social and health trends, and making important legislative, commercial (marketing) and health decisions. Statistics are gathered from census and registrars’ reports, physicians’ records, medical examiners’/mosque records, grave yards, and a variety of other health professionals
Rates: Denominators and Numerators
Rates or ratios are used to measure most health problems. They consist of numerators and denominators: a count of events divided by the number of possible events
Numerators and denominators used in public health statistics are of three types:
• Survival data (births, deaths, and a count of the population
• Health and socioeconomic status data
• Data based on health resources and utilization
The Denominators
The most important information on which activities in public health must be predicated is a count of the population to be served. The decennial census is an important and the most widely used information as the denominator (defacto/dejure). We may include intercensal estimates, based on projects or sample surveys.
Other sources of information may also be used, depending on the phenomenon of interest; for example:
School enrollment records
Employer records of numbers of workers
Airline carriers for numbers of passengers carried during a given time
Numerator data stems from administrative registration and reporting procedures. Most significant of activities relate to the vital events of birth, mortality (death), and morbidity (disease, illness, and injury.
Types of Data
Just as we must classify and organize information before we can retrieve and use it , we must classify data into the correct type before we can do any statistical analysis on them.
The data type will determine :
• How data can be coded for analysis?
• What kind of analysis can be performed?
1. Categorical data
a. Nominal data:
Variables are divided into a number of named categories without any intrinsic order e.g. Sex, marital status.
b. Ordinal data:
Variables divided into number of ordered categories e.g. level of knowledge, opinion on a statement
2. Numerical Data (expressed in numbers):
Possible values take a distinct series of numbers:
a. Discrete
b. continuous
Numerical data is examined through:
1. Frequency distribution
2. Percentages, proportions, ratios, rates
3. Figures
4. Measures of central tendency
5. Measures of dispersion
Frequency distribution of numerical data (grouping of data)
For frequency distribution, we:
a. Select groups for grouping the data
b. Count the number of measurements in each group
c. Add up and check the results
d. GROUPING RULES:
- Groups must not overlap
- No gaps (continuity in groups)
- Groups range from lowest to highest measurement; round numbers for lower values)
- Equal width for comparability
Variables
A variable is a characteristic of a person, object, or phenomenon that can take on any or different values. Examples include:
- Age in years, months, weeks
- Weight in Kg, pounds, stones, mg
- Distance in m, km , walking minutesMonthly income
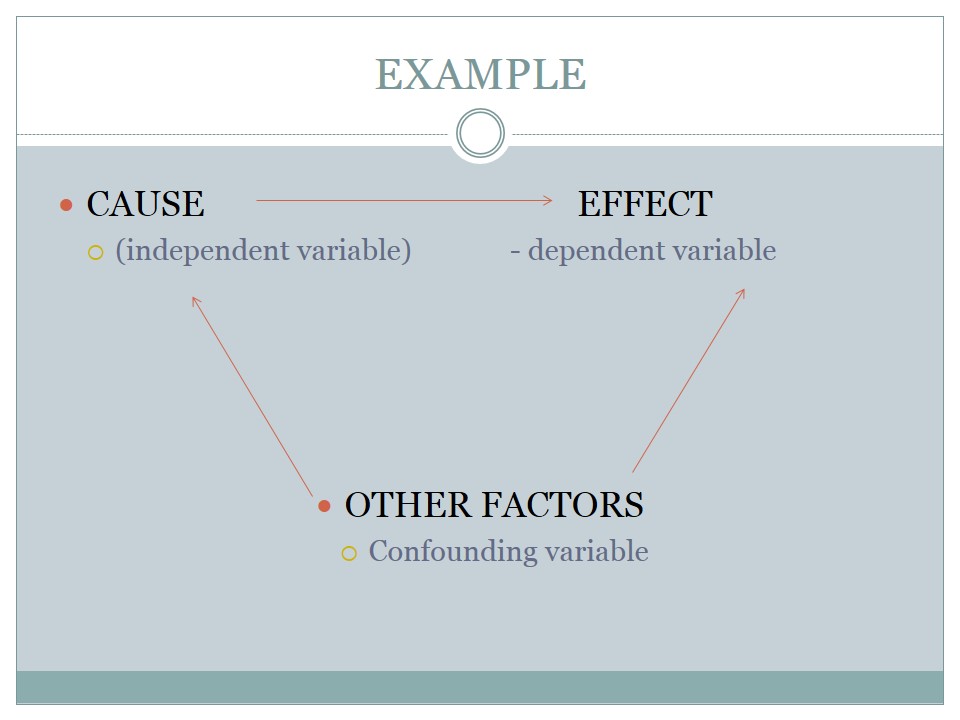
Dependent Variable
The variable used to describe or measure the problem under study
Independent Variable
The variables used to describe or measure the factors that are assumed to cause or at least to influence the problem.
Confounding Variable
Variable related to both above variables
Interval data
Interval data has no absolute ZERO point, so we cant use comparisons as to twice as much or half as many with interval data.
Ratio data
Ratio data provides information detailed information on how much greater or lesser. We can use comparisons as to ‘twice as many ‘with confidence and surety.